Retail Media Performance Metrics: what to track from exposure to incremental sales
Retail media measurement often fails for a simple reason: one dashboard is asked to answer several different questions.
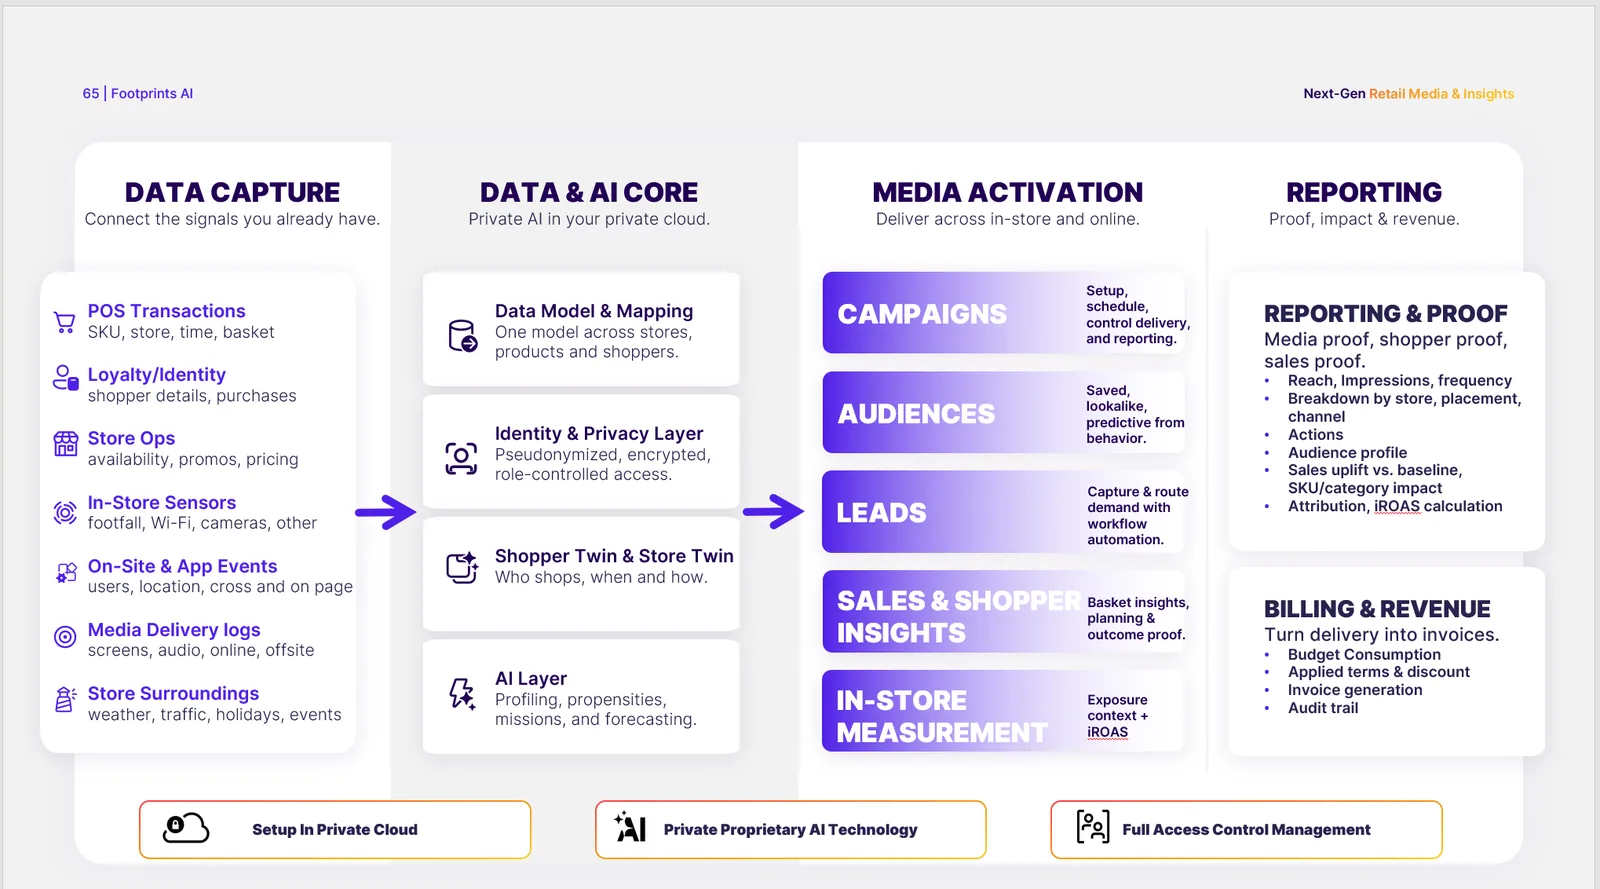
Impressions tell you whether media was delivered. Clicks and product-detail views show response. Attributed sales connect media contact to transactions under a stated attribution rule. Incremental sales estimate what the campaign caused beyond what would have happened anyway. These are not interchangeable levels of proof.
A useful metric system therefore works as a chain. It starts with campaign delivery, moves through shopper behavior and commercial outcomes, and ends with a causal test where the decision requires one.
Which retail media metrics should you track?
Track metrics as a chain from delivery to engagement, commerce, efficiency and incrementality, with each layer tied to a different decision.
This guide is for brand media leads, retailer media-network teams, shopper marketers and analysts who need to design a measurement plan before launch. It does not cover dashboard design, attribution implementation or the detailed mechanics of incrementality studies.
Build the metric chain before choosing KPIs
The IAB/MRC Retail Media Measurement Guidelines establish common definitions for placement, audience, engagement and outcome measurement, including the need to state whether a placement metric covers organic activity, paid activity or both. IAB Europe’s Commerce (Incl. Retail) Measurement Standards V2.1 organize online commerce-media measurement across media metrics, attribution, insights and incrementality.
For planning purposes, organize metrics into five layers.
- CPM. Formula or denominator: Spend ÷ impressions, expressed per thousand impressions. Question answered: What did delivery cost? Misuse warning: Non-causal; define the impression type.
- CTR. Formula or denominator: Clicks ÷ the stated impression denominator. Question answered: Did shoppers interact? Misuse warning: Non-causal; served- and viewable-impression CTR are not directly comparable.
- Attributed ROAS. Formula or denominator: Attributed sales ÷ ad spend. Question answered: How much rule-matched revenue was reported per ad-spend unit? Misuse warning: Non-causal; depends on attribution, sales scope and identity coverage.
- Absolute purchase-rate lift. Formula or denominator: Treatment purchase rate − control purchase rate. Question answered: How many percentage points did purchase incidence change? Misuse warning: Causal only with a credible counterfactual and aligned populations.
- Relative lift. Formula or denominator: (Treatment rate − control rate) ÷ control rate. Question answered: How large was the change relative to the control baseline? Misuse warning: Causal only with a credible counterfactual; do not call it percentage-point lift.
- iROAS. Formula or denominator: Incremental revenue ÷ ad spend. Question answered: How much additional revenue did each ad-spend unit generate? Misuse warning: Causal only when the numerator comes from a credible counterfactual.
1. Delivery: did the campaign run as bought?
Delivery metrics include served impressions, viewable impressions where applicable, reach, frequency, spend, pacing and valid traffic. For sponsored products, the definition of an impression must say whether the product was actually rendered in a shopper-visible position rather than merely returned by a system.
Use delivery metrics to diagnose execution. They can reveal underdelivery, excessive repetition, invalid traffic or a placement that never became visible. They cannot establish commercial impact.
The decision supported is operational: Should the team fix delivery, change inventory or adjust pacing?
2. Engagement: did shoppers respond to the placement?
Engagement metrics may include clicks, product-detail-page visits, video completions, saves, coupon activations, store-locator use or other format-specific actions. The denominator must remain explicit. Click-through rate based on served impressions is not directly comparable with a rate based on viewable impressions.
Engagement is most useful as a creative, placement and audience diagnostic. A low rate can reflect weak creative, poor relevance, inconvenient placement or a high-friction landing experience. A high rate can still produce weak sales if the product is unavailable, mispriced or poorly matched to the shopper mission.
The decision supported is tactical: Which message, audience or placement deserves another test?
3. Commerce: what happened in the transaction?
Commerce metrics include attributed orders, attributed sales, units, average order value, new-to-brand outcomes where the identity method supports them, and same-SKU or broader brand/category sales. Every result needs an attribution window, identity rule, product scope, channel scope and deduplication rule.
Attributed sales answer a connection question: Which transactions meet the reporting rule after a recorded media contact? They do not, by themselves, answer what the campaign caused.
That distinction is central to the IAB and IAB Europe incrementality guidance, which treats credible counterfactuals, bias control and separation of signal from noise as the foundations of causal measurement.
4. Efficiency: how much outcome was associated with the spend?
Efficiency metrics include cost per thousand impressions, cost per click, cost per acquisition and attributed ROAS. They help compare buying efficiency under consistent definitions.
Do not compare two ROAS figures unless their sales scope, attribution window, identity coverage, returns treatment and media-cost denominator match. A same-SKU ROAS and a total-brand ROAS can both be correct while telling different stories.
The decision supported is allocation: Which tactic produces the required outcome most efficiently under the agreed reporting rule?
5. Incrementality: what changed because of the campaign?
Incremental sales, incremental buyers, conversion lift and iROAS require a counterfactual. The comparison may come from a randomized holdout, a geo experiment, matched stores or another credible design. The method should be selected before launch, not reverse-engineered after results arrive.
Incrementality supports the highest-stakes decision: Should the buyer add budget, repeat the tactic, redesign the test or stop spending?
For the broader causal framework, see Incrementality: The Metric That Turns Retail Media Into a Growth Budget. For experimental design, see Holdout Groups: Retail Media’s Cleanest Incrementality Test.
A worked measurement plan
Consider a grocery campaign designed to recruit light category buyers for a new premium pasta sauce.
The campaign job is not simply “drive sales.” It is to increase first purchases among eligible light buyers in stores where the product is available.
The metric chain might be:
- Delivery: verified or estimated eligible-shopper reach, with identity coverage and estimation method disclosed, plus frequency and valid rendered impressions.
- Engagement: product-page visits or offer activations, used as diagnostics rather than proof.
- Commerce: purchasing households, units and sales for the promoted SKU, plus clearly separated brand-halo sales.
- Efficiency: cost per first purchasing household and attributed ROAS under a defined window.
- Incrementality: difference in purchase rate between treatment and a randomized eligible holdout, with confidence intervals and contamination checks.
Availability is a measurement condition, not a footnote. If many treatment stores are out of stock, the campaign may be delivered correctly while the commercial outcome is suppressed. Report media delivery and product opportunity together.
Choose one primary KPI and name the guardrails
A campaign can have many metrics but should have one primary success rule. The primary KPI follows the campaign job.
- An awareness job may prioritize verified reach within the intended audience, with frequency as a guardrail.
- A consideration job may prioritize qualified product exploration, with bounce or short-session behavior as diagnostics.
- A conversion job may prioritize incremental buyers, incremental units or incremental sales.
- A profitability job may prioritize iROAS or incremental contribution after media cost.
Guardrails prevent a local win from hiding a broader loss. Examples include excessive frequency, declining category value, increased returns, margin dilution, stockouts or sales shifting from another SKU in the same portfolio.
Reporting rules that stop metrics from drifting
Before launch, write a metric contract covering:
- the business question and primary KPI;
- numerator and denominator definitions;
- eligible population and exposed population;
- paid, organic or combined placement scope;
- same-SKU, brand, category and halo-sales boundaries;
- online, in-store and omnichannel transaction scope;
- attribution and lookback windows;
- identity, match-rate and deduplication rules;
- treatment of cancellations, returns, taxes and discounts;
- stock, distribution and promotion context;
- counterfactual method and statistical uncertainty;
- the decision that follows a strong, weak or inconclusive result.
This contract makes the post-campaign review shorter because the team is not renegotiating definitions after seeing the outcome.
Common measurement mistakes
Treating the funnel as a causal path
A shopper can see an ad, click and buy without the ad causing the purchase. Funnel continuity is useful for diagnosis; it is not a counterfactual.
Promoting every metric to KPI status
When reach, clicks, sales, ROAS and lift are all declared primary, the campaign can always find a success. Choose a hierarchy before launch.
Hiding scope changes
Switching from promoted-SKU sales to total-brand sales can make performance appear stronger. Broader scope may be valid, but it must be labeled and agreed.
Ignoring measurement coverage
Identity resolution, consent and retailer transaction coverage determine which shoppers can be measured. Report the observable population rather than implying universal coverage.
Comparing unlike studies
A campaign measured with last-touch attribution is not directly comparable with one measured through a randomized holdout. Preserve the method beside the number.
A practical pre-launch checklist
Confirm that:
- the campaign has one written commercial job;
- each metric belongs to delivery, engagement, commerce, efficiency or incrementality;
- the primary KPI matches the job;
- attributed and incremental outcomes are separated;
- product scope and sales scope are explicit;
- stock and promotion conditions will be captured;
- the comparison design is feasible before launch;
- uncertainty and data coverage will be reported;
- the buyer has agreed what action follows each result.
FAQ
Which retail media metric matters most?
There is no universal metric. The primary KPI must match the campaign decision. Delivery metrics govern execution; attributed commerce metrics govern reporting; incremental outcomes govern causal budget decisions.
Is ROAS enough?
No. ROAS is useful only with a clear sales scope and attribution rule. It does not show whether the sales would have happened without the campaign. For that, use an incremental design and, where appropriate, iROAS.
Should every campaign run an incrementality test?
Not necessarily. The value of stronger proof should justify the cost, complexity and required sample. High-spend, repeatable or strategically important campaigns are stronger candidates than small tactical placements.
What belongs on an executive scorecard?
Show the campaign job, primary KPI, spend, the result under a named method, uncertainty, major guardrails and the resulting decision. Put diagnostic detail below that layer.
Bottom line
Retail media performance is not one number. It is a controlled progression from delivery to response, transactions, efficiency and causality. The metric system works when each layer answers a different question and the buyer knows which level of evidence is strong enough for the decision at hand.
Sources
- IAB/MRC Retail Media Measurement Guidelines, Interactive Advertising Bureau and Media Rating Council, January 2024.
- Guidelines for Incremental Measurement in Commerce Media, IAB and IAB Europe, November 2025.
- IAB Europe Commerce (Incl. Retail) Measurement Standards V2.1, IAB Europe, May 2026.
Ready to see how this works in practice?
Footprints AI helps brands and retailers measure what matters. See our customer success stories or get in touch to discuss your retail media strategy.