Measurement & attribution guide
How next-gen in-store retail media measurement works
An ad playing is not proof of attention or extra sales. See how Footprints AI separates delivery, exposure and purchase evidence, so you can choose what to measure and understand what each result supports.
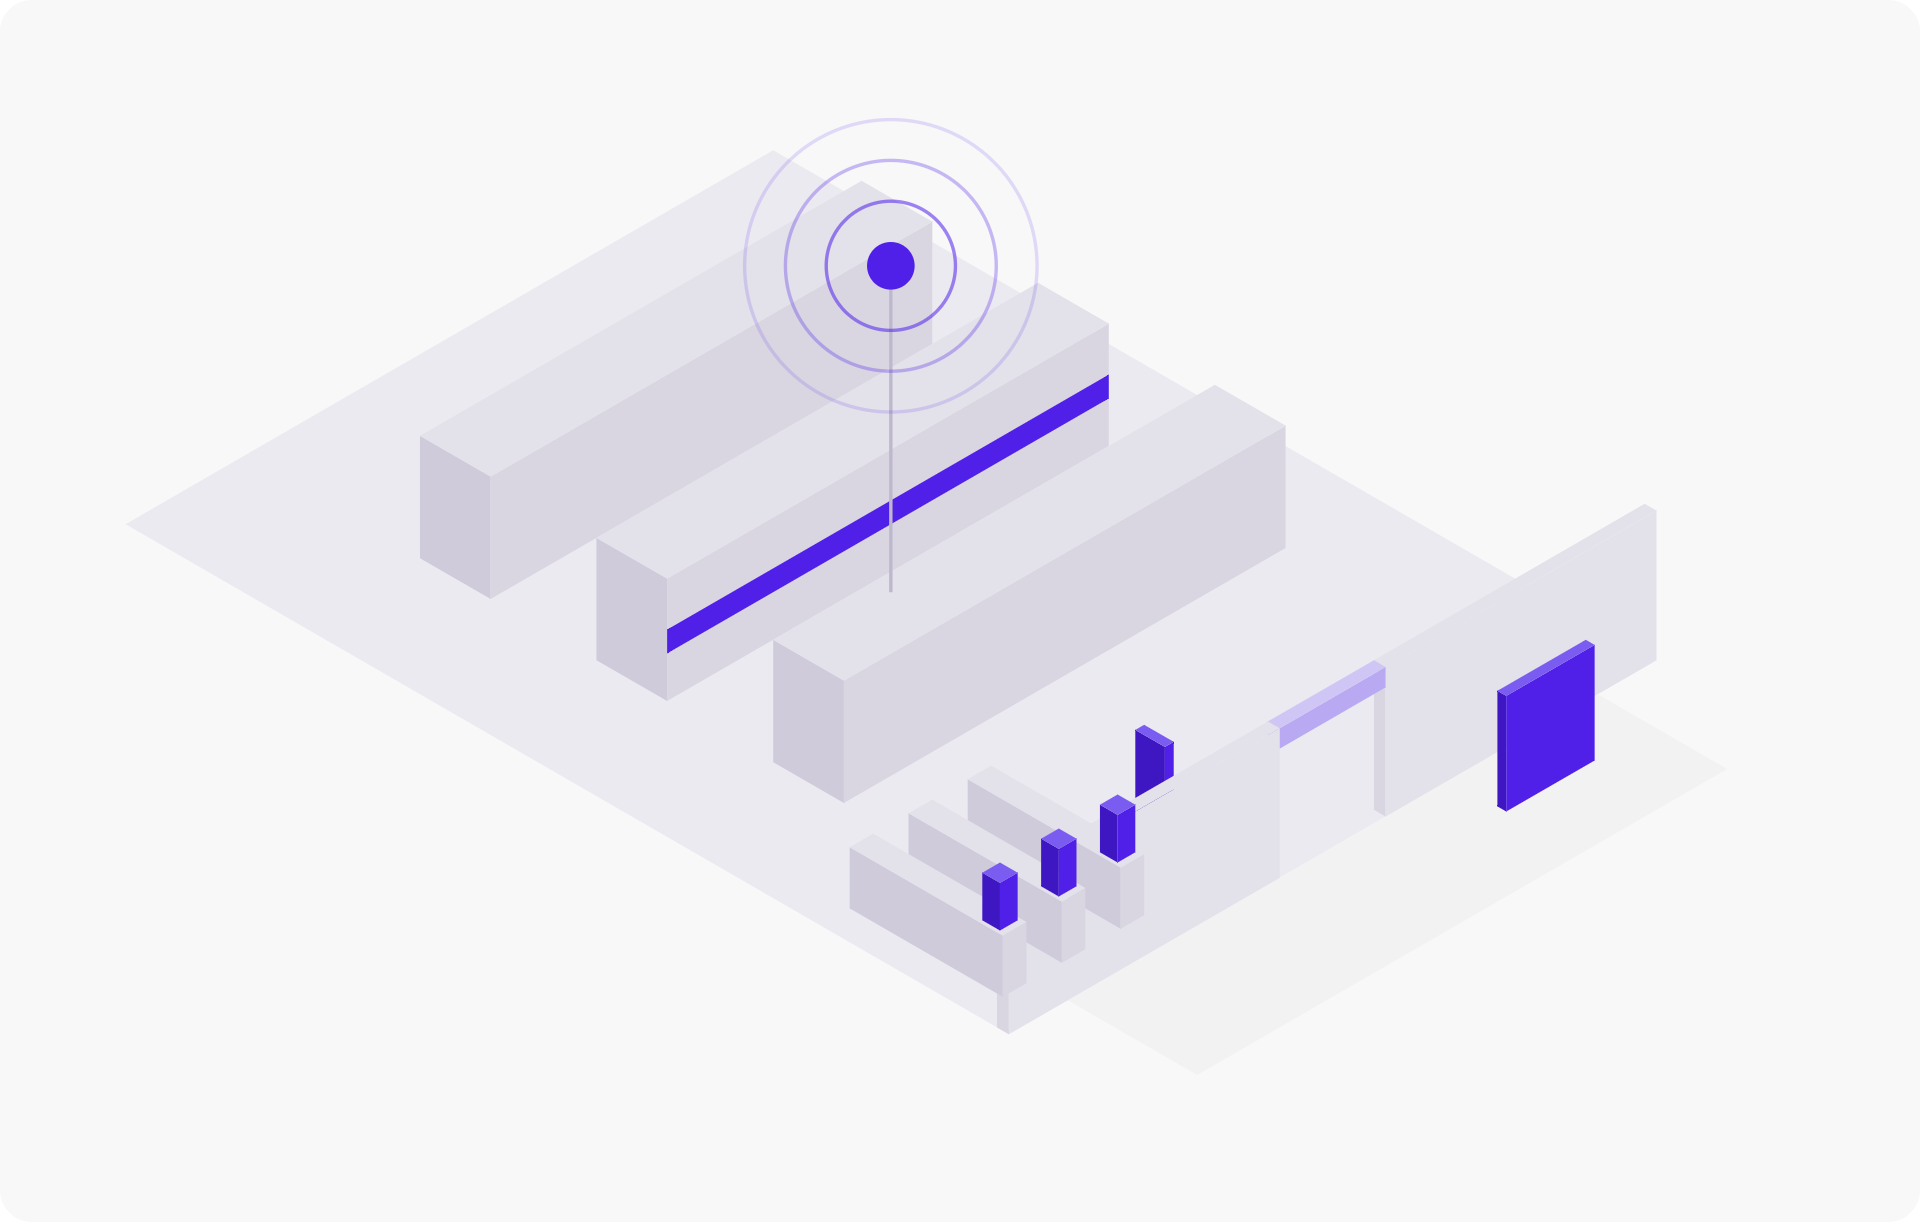
Start with the question behind the number
Delivery, exposure, attention and sales answer different questions. One kind of evidence does not prove the next.
Delivery
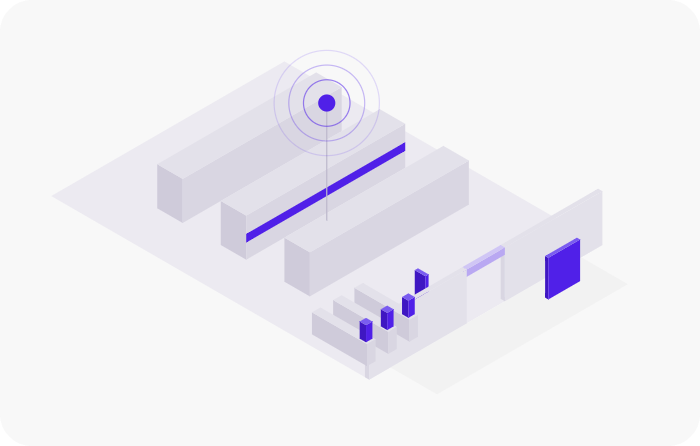
A confirmed play records that the ad ran on a working screen or speaker. It does not establish an audience.
Exposure
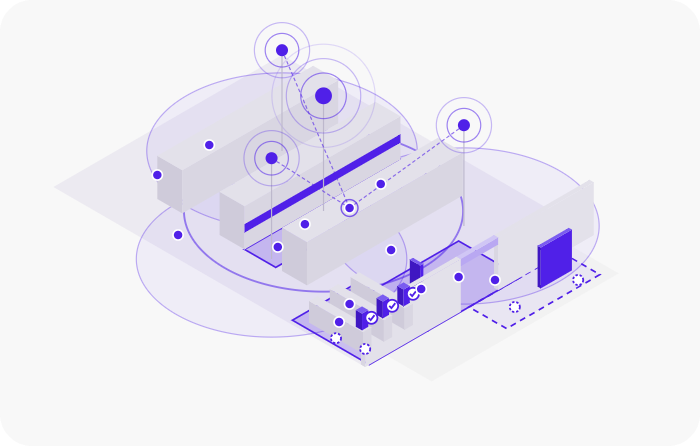
An opportunity to see or hear (OTS or OTH) matches observed or modeled presence to a media zone and play interval. It is not attention.
Attention
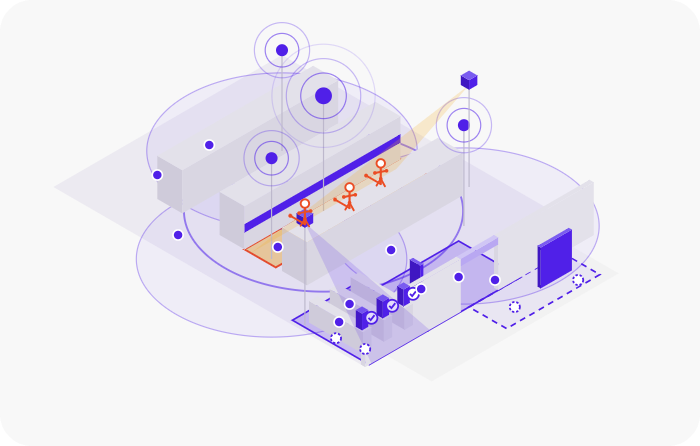
A likelihood-to-see (LTS) estimate needs a separately validated method. Facing a screen does not prove reading.
Sales outcomes
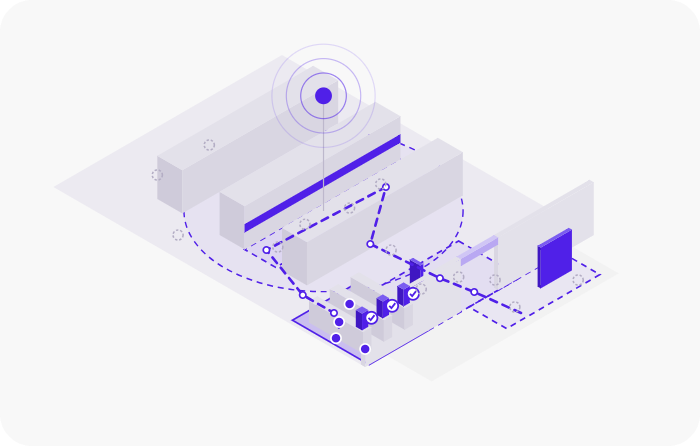
Attribution: A purchase is linked to exposure under a stated matching rule and time window. A link does not establish cause.
Incrementality: Additional sales are estimated against a credible comparison. Attribution alone cannot answer this question.
What counts as an in-store exposure?
Screens and radio need different checks. Keep plays, opportunities, attention estimates and reach separate, with their own units and populations.
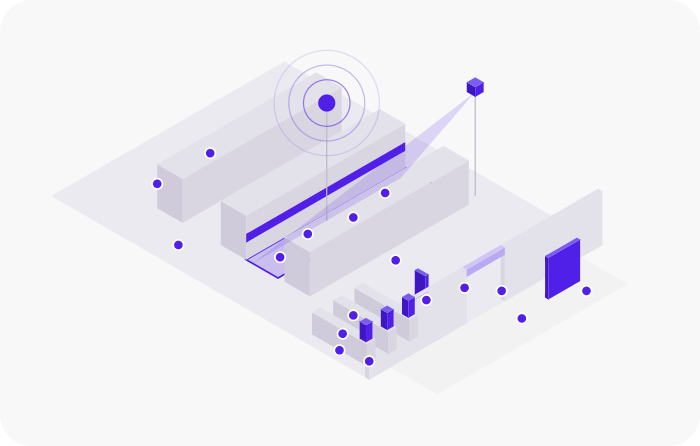
Screens: check the viewing area
Confirm that the ad played on a working screen. Define where it can be seen, then match presence to that area during the play. Direction and blocked views refine the count. Completing a video is delivery evidence, not proof of watching.
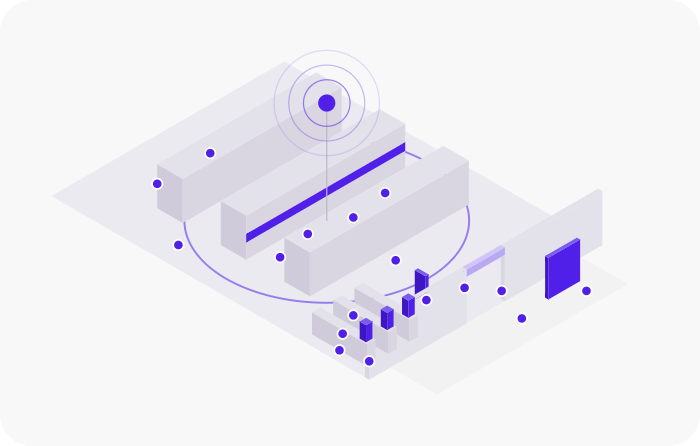
Radio: check audible coverage
Confirm playback in the relevant part of the store, with speakers on and unmuted. Calibrate how far sound carries when the store is busy, then match presence to that area during the ad. Dwell divided by message cadence estimates contacts, not messages heard.
What can your available data establish?
Five source types feed six native engines. Use the sources your store supports, not a mandatory technology ladder or ranking of accuracy. Each result keeps its evidence basis and covered population.
Six engines, native to the platform
Estimator AI Engine
Source 1 · Modeled
Input: Store context and comparable stores
Produces: Modeled flows and opportunities per scenario.
Synthetic Path AI
Source 2 · Modeled path
Input: Baskets, times and a digital twin
Produces: An inferred journey, plausible path and exposure.
Wi-Fi Analytics
Source 3 · Observed devices
Input: Wi-Fi observations
Produces: Device visits, location and dwell in media zones.
Computer Vision AI
Source 4 · Observed; qualified where validated
Input: Camera feeds or events
Produces: Counts, movement, facing and qualified visual signals where validated.
Indoor Positioning & Navigation SDK
Source 5 · Observed participants
Input: App or cart devices
Produces: Calibrated paths and dwell; measurement and navigation for participating devices.
Sensor Fusion Engine
All sources · Basis retained
Input: Available source signals
Produces: Aligned, deduplicated and checked metrics that keep their evidence basis.
Five source types, used as your store supports them
1. Our estimate

- You give us
- Nothing
- We can then count
- Planning opportunities per screen and speaker, with assumptions stated.
2. Your sales data

- You give us
- Sales data from the tills
- We can then count
- Purchases per store and hour, and purchases linked to exposure under a stated method.
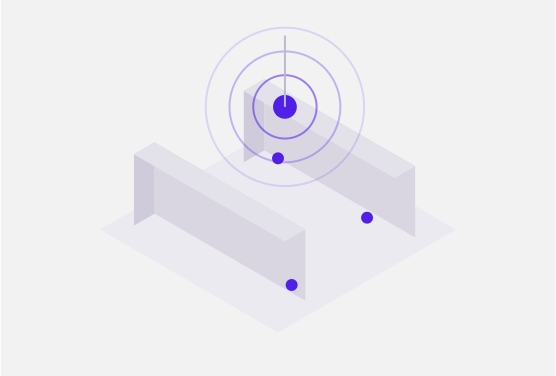
3. Your store Wi-Fi
- You give us
- Wi-Fi location data and access-point positions
- We can then count
- Device presence and dwell near each screen and speaker, within coverage.
4. Cameras

- You give us
- Camera feeds or events, plus floor plans
- We can then count
- People, movement and facing in camera zones; attention where validated.
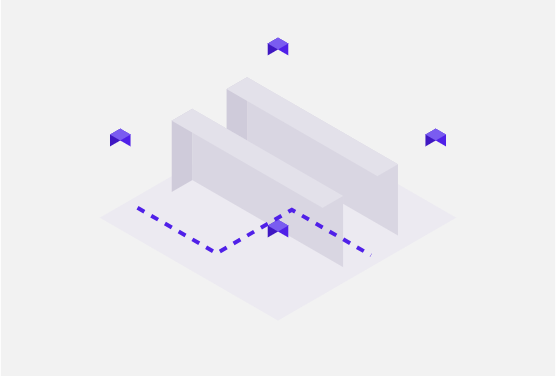
5. Indoor positioning
- You give us
- Your app or smart carts with the SDK, and a calibrated map
- We can then count
- Paths and dwell for app or cart users, with customer links where permitted.
You don't need all five. Use the sources your stores already support. Each one adds a different kind of evidence. Sales data, for example, shows what was bought, not the route through the store.
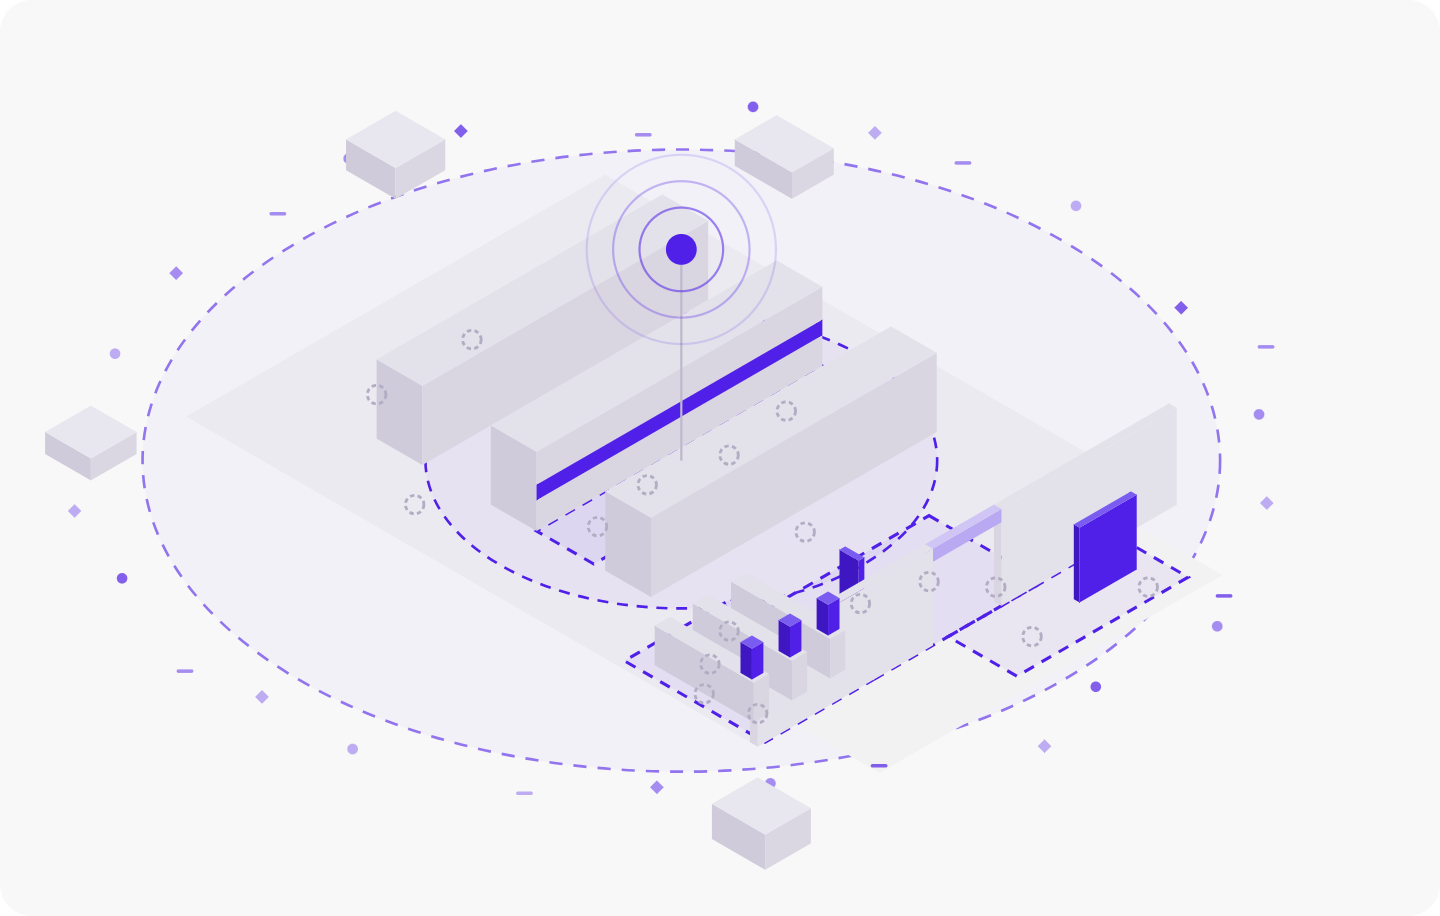
Estimator AI Engine
Input: Store context, comparable stores and stated assumptions. A store list, opening hours and placement inventory help; no new till, sensor or customer-data integration is needed.
Supports: Modeled visitor flows and weekly opportunities per screen or speaker scenario, expressed as planning ranges.
Limits: Zero-touch does not mean zero assumptions. This does not prove delivery, viewing or accuracy before validation. Overlapping placement audiences must not simply be added.
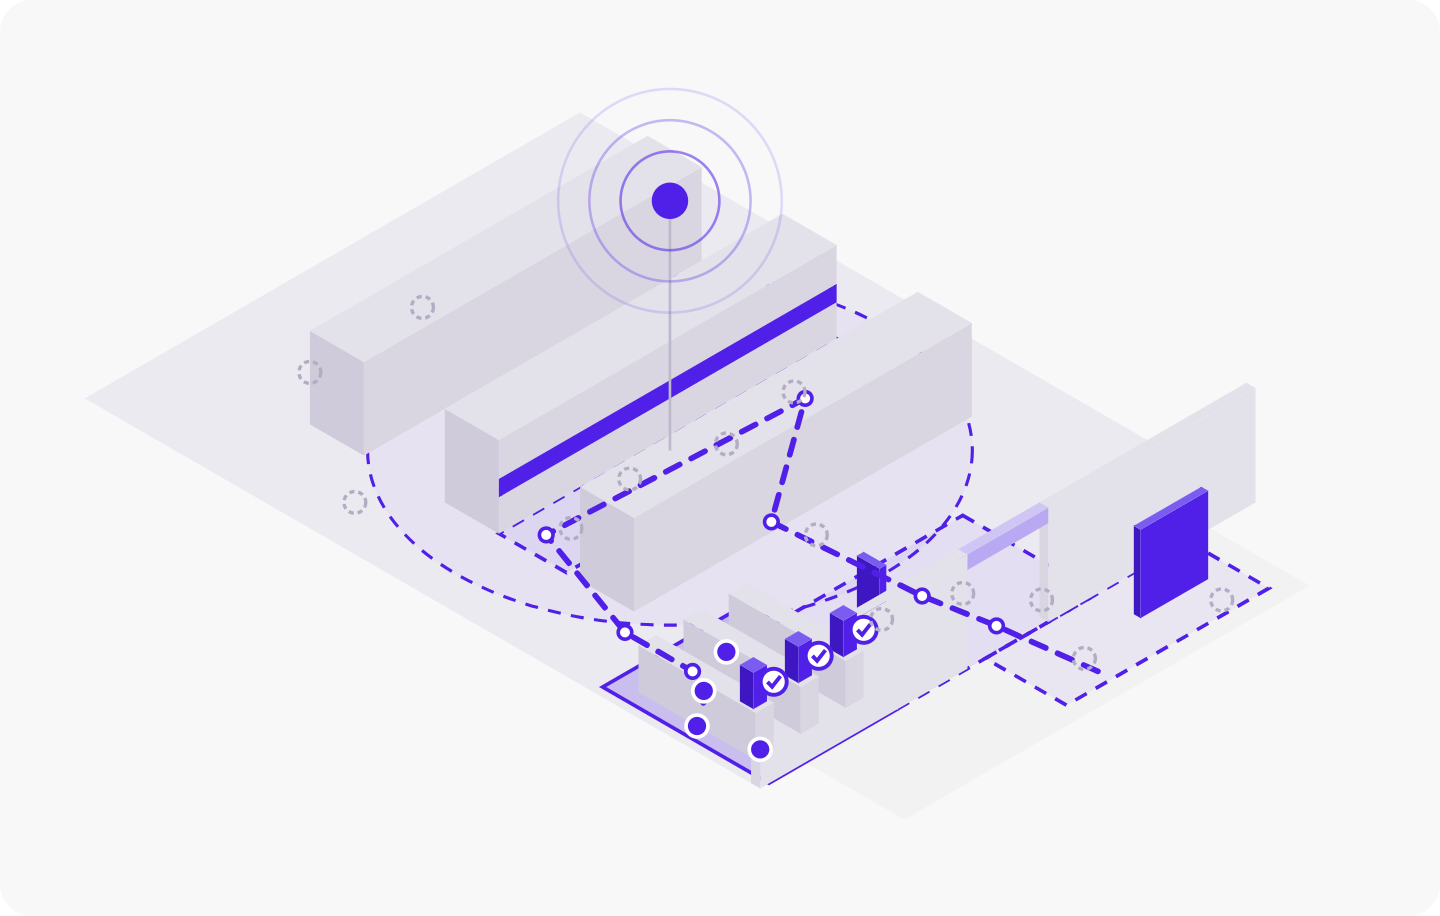
Synthetic Path AI
Input: Till records by store and time, baskets and a digital store model; pseudonymised loyalty IDs where allowed.
Supports: Purchase counts, a plausible route per basket and possible exposure. The result is hybrid: observed purchases, modeled journey. Presence sources can narrow covered segments.
Limits: A transaction is not necessarily one shopper. Second-by-second output is model resolution, not known position. Routes, timing, companions and non-buyers remain inferred unless supported. Linked sales are not caused sales.
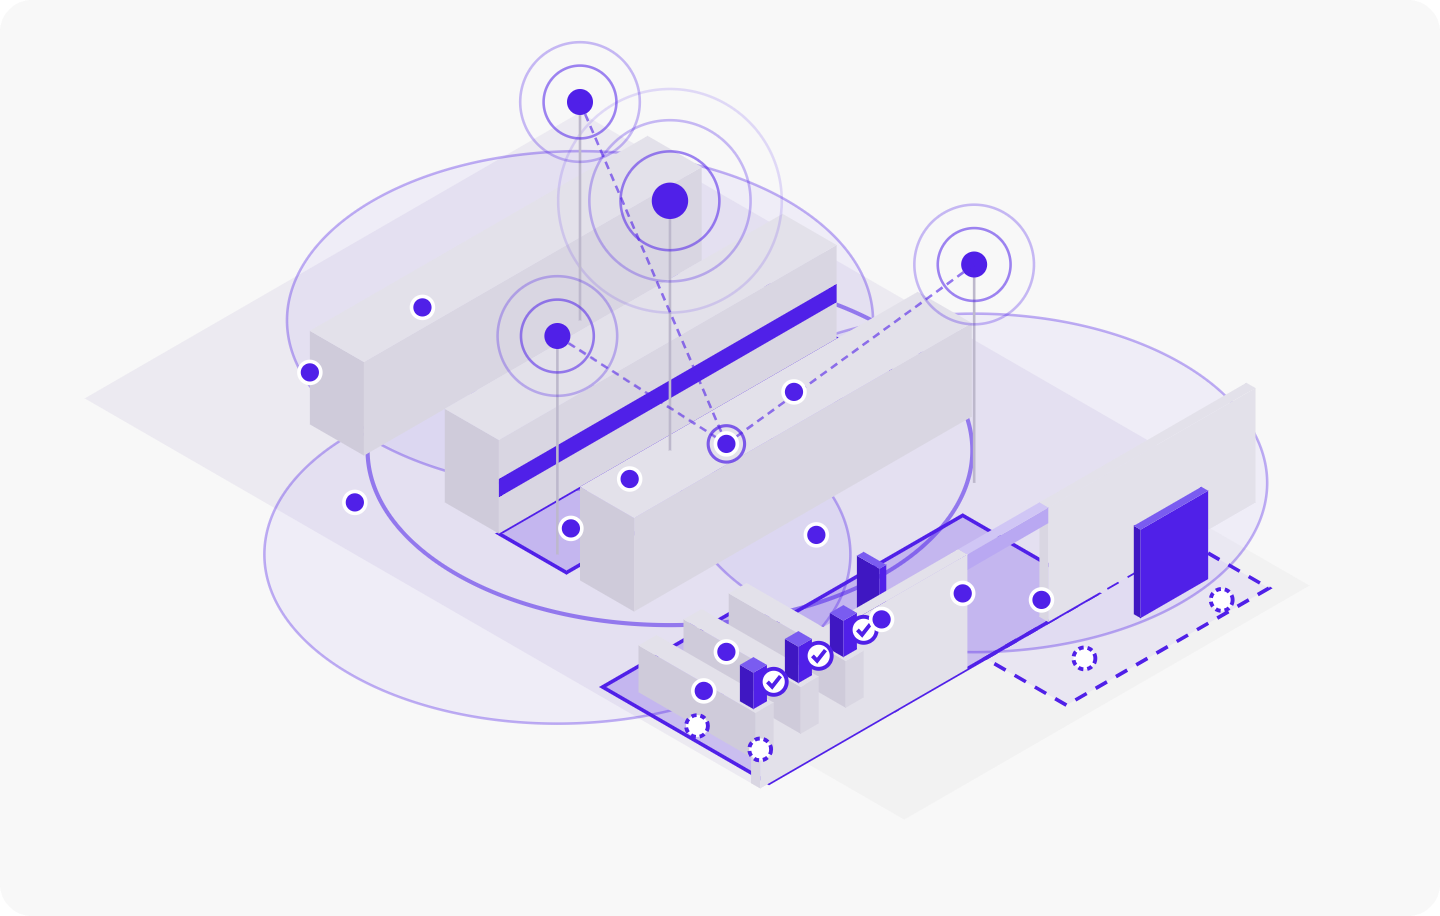
Wi-Fi Analytics
Input: Supported access-point location data, configuration and positions; optionally door counters.
Supports: Observed device detections and estimates of location and dwell in covered media zones, matched to plays. Supported infrastructure may detect phones without a network connection.
Limits: Handsets, settings, identifier rotation and coverage affect detection. A device is not a person. Undetected shoppers are estimated, not observed; positions carry uncertainty. Presence does not prove facing or hearing.
Computer Vision AI
Input: Supported camera feeds or events, floor plans, camera positions and a validation plan per screen.
Supports: Counts, movement, dwell and facing in camera zones, using pose-style outputs rather than identities. Facing supports qualified views only where validated for that screen.
Limits: Facing is not reading; not every camera is suitable. Attention needs separate validation. Pose output alone does not establish raw-video handling: permitted processing and retention belong in the data agreement.
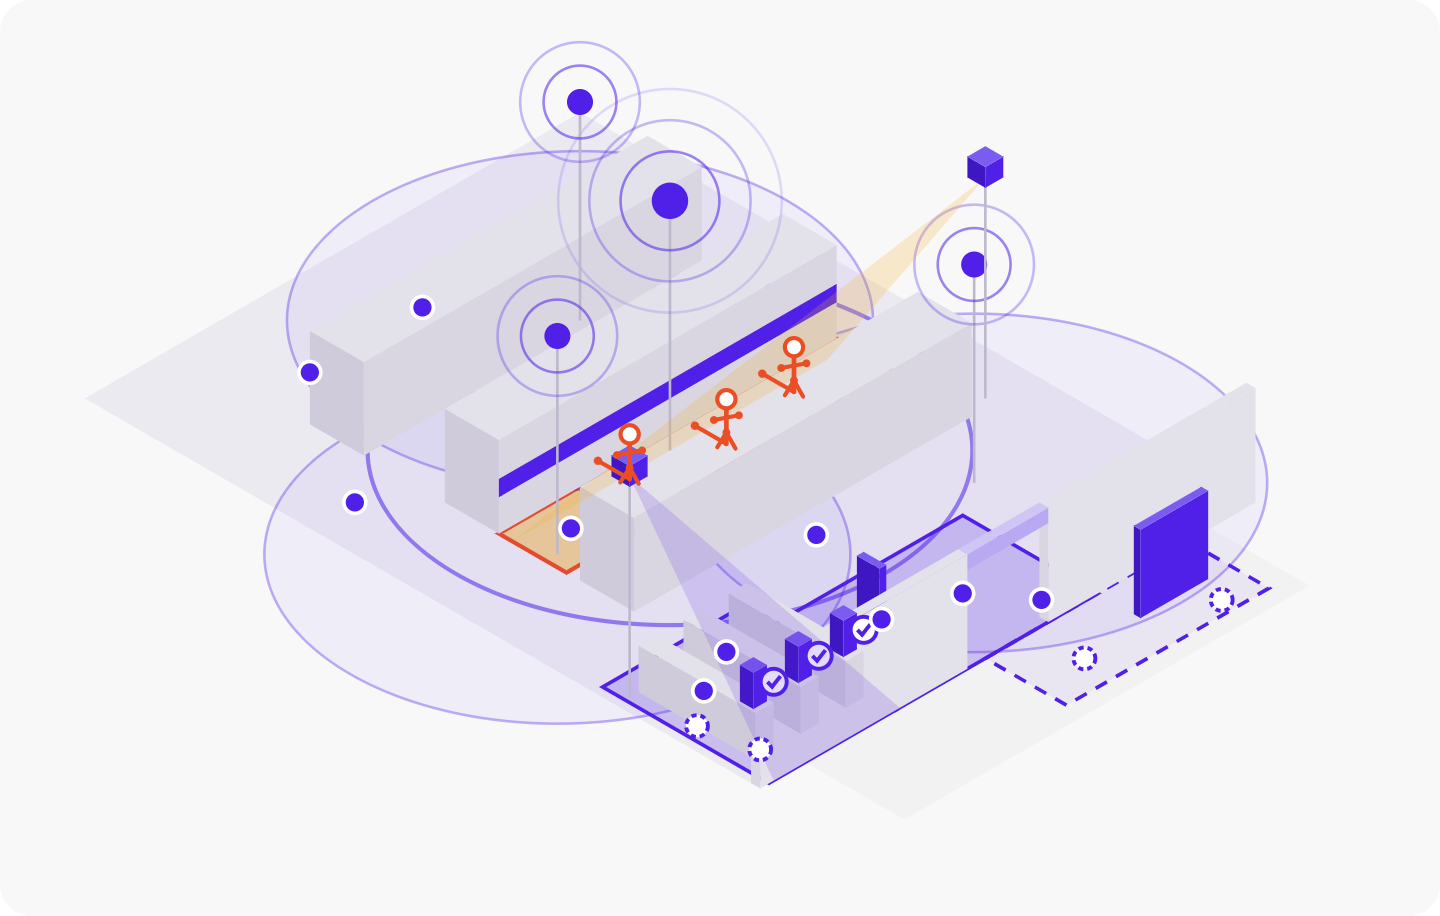
Indoor Positioning & Navigation SDK
Input: A retailer app or smart cart with the SDK, a calibrated map and agreed accuracy, coverage, latency and clock criteria.
Supports: Calibrated paths and dwell for participating devices; customer or purchase links where permitted. Shelf navigation and location-based recommendations are activation features, distinct from measurement.
Limits: Non-participants remain outside this observed population. One device is not necessarily one person. Paths do not establish looking or listening; signing in does not permit every use.
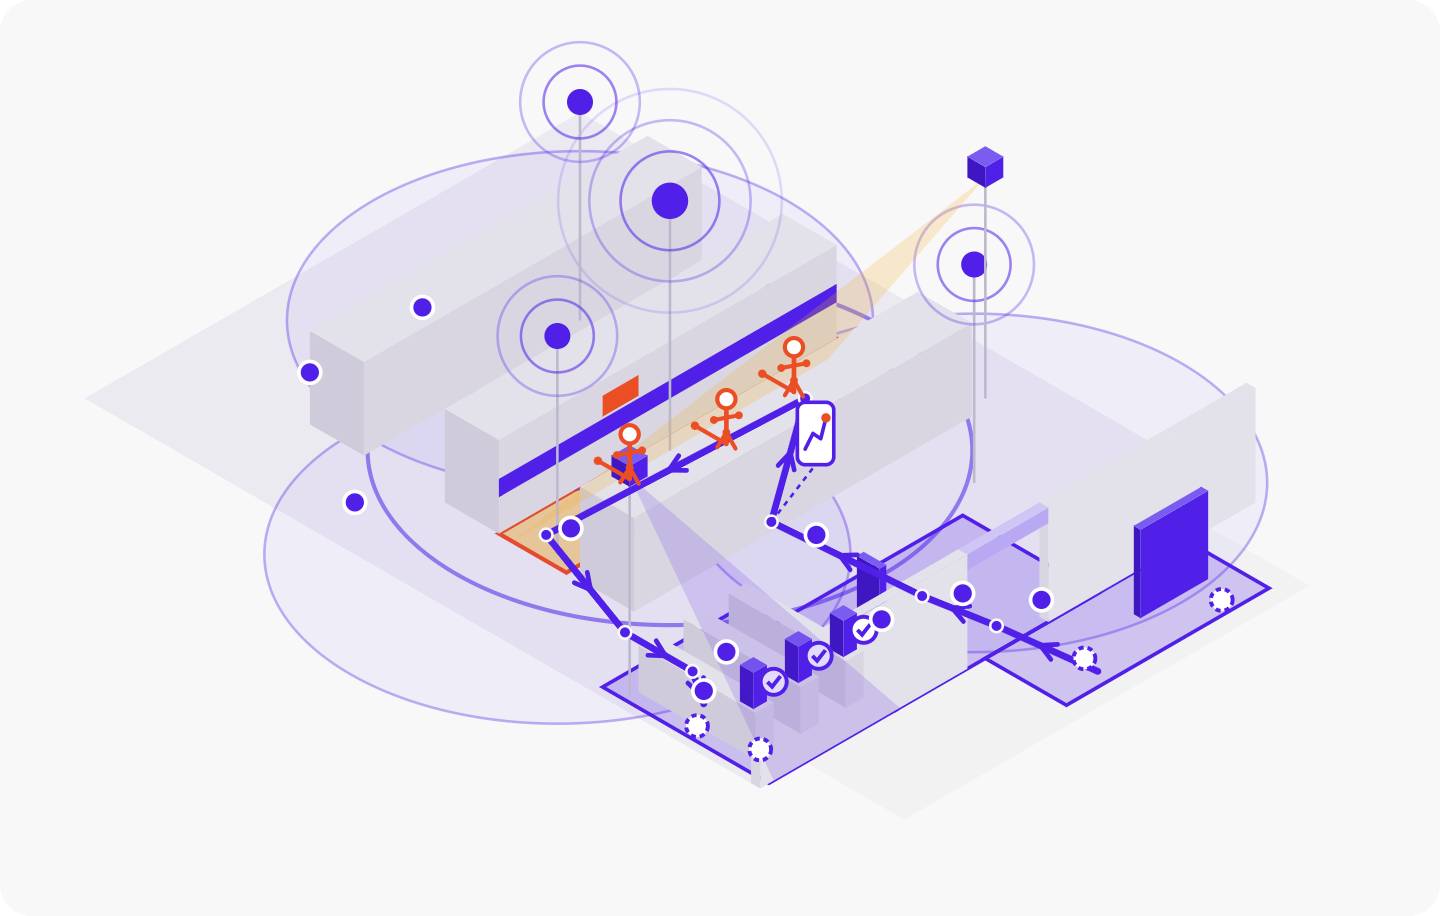
Sensor Fusion Engine
Input: Available estimates, sales, presence, location and playback records.
Supports: Signals aligned in time and space, checked and deduplicated, producing separate exposure, qualified-attention and linked-purchase outputs.
Limits: Combining sources does not turn inference into observation. Missing coverage stays visible; different metrics are never added into one total.
From evidence to a useful report
Better evidence replaces or narrows assumptions. Purchase events replace estimated buyers; covered presence narrows placement audiences; validated cameras refine facing; player logs and endpoint status replace scheduled-play assumptions.
How Sensor Fusion combines the five sources
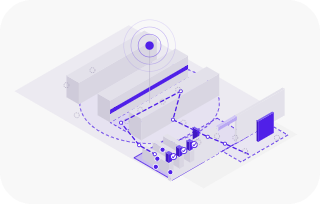
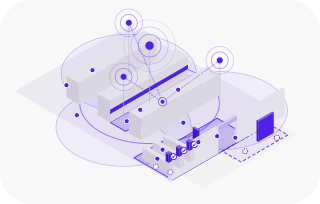
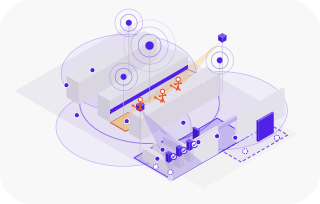
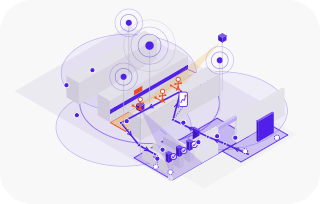
Sensor Fusion
Separate outputs
- Opportunities to see or hear
- Attention, where validated
- Linked purchases, rule stated
A journey example, with its evidence labeled
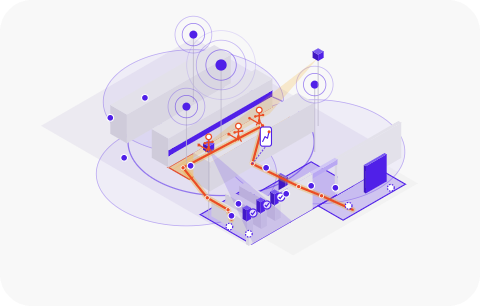
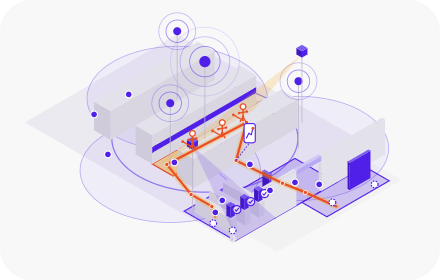
Consider a schematic journey from entrance to exit. With sales data alone, the route is modeled. Wi-Fi, cameras or the SDK can support observed segments within their coverage; the rest stays modeled. Ad plays and purchase matches are separate records, not facts read from the moving path. This illustrates the workflow, not deployment accuracy.
Our reporting standard: eight facts with every metric
| Fact | What it identifies |
|---|---|
| Which store, screen and ad | Store, placement or endpoint, creative or campaign |
| How it was measured | Source, method and version; period and timezone |
| Observed, modeled or hybrid | The basis of the figure, and the population it covers |
| Whether the ad really played | Scheduled versus confirmed play; endpoint status |
| Area counted, error margin | Visual or acoustic zone; location and time uncertainty |
| How devices became people | Device-to-person conversion, exclusions, extrapolation |
| What kind of number it is | Play, OTS/OTH, attention estimate or reach, and its rule |
| Linked outcome, and how | Matching or comparison method, window, limitations |
These facts make the basis of store-to-store or week-to-week comparisons visible. Billing follows the contracted unit and the evidence actually available.
When coverage changes, the label changes
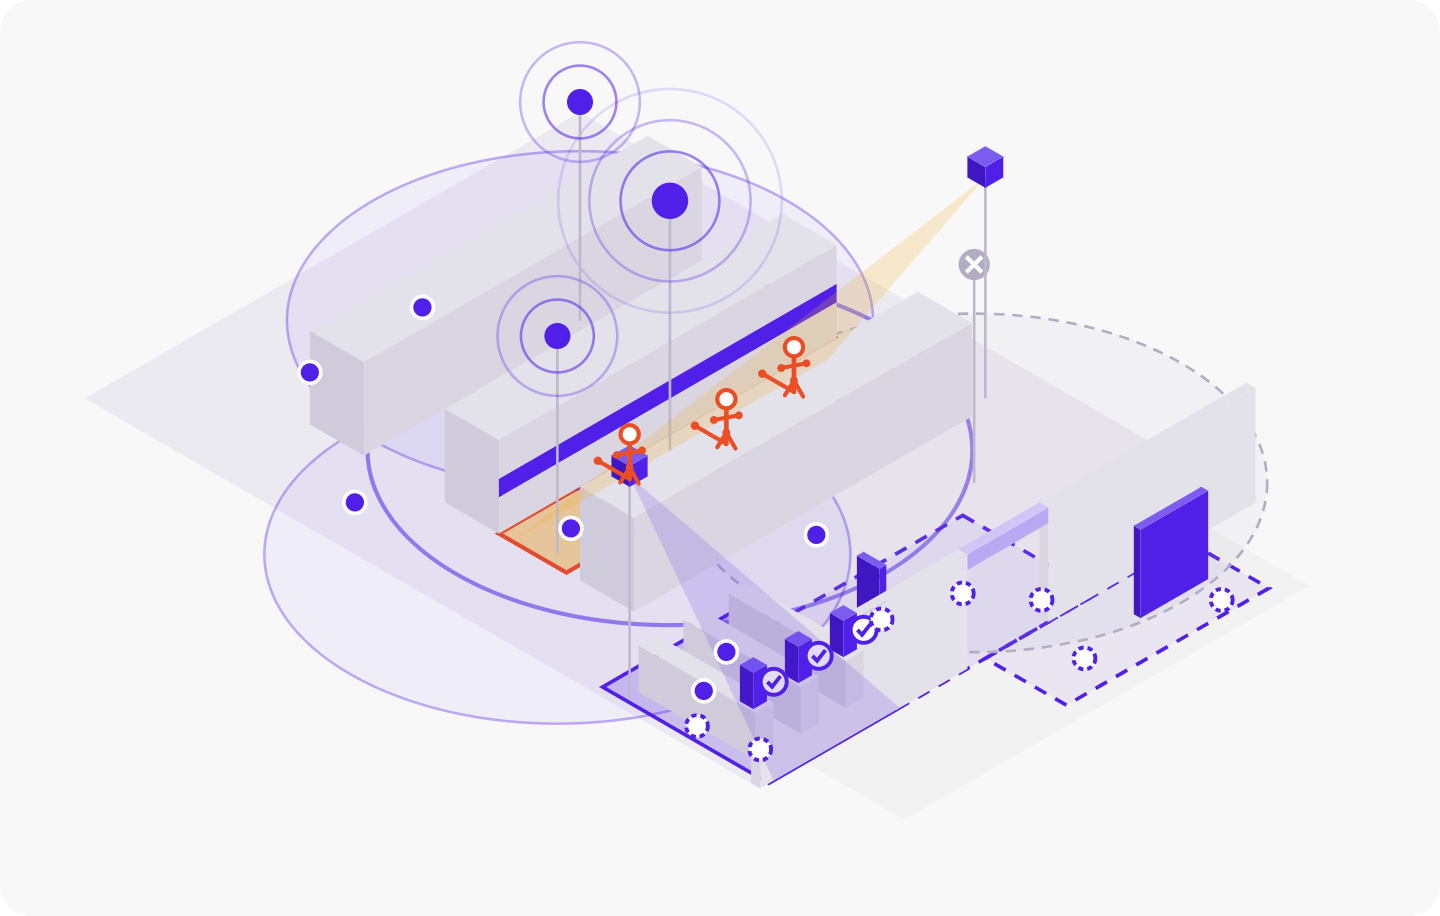
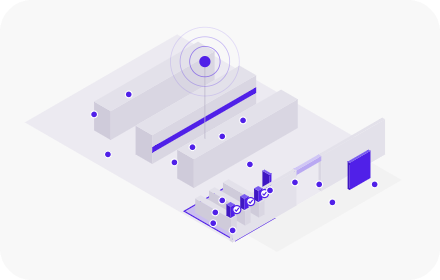
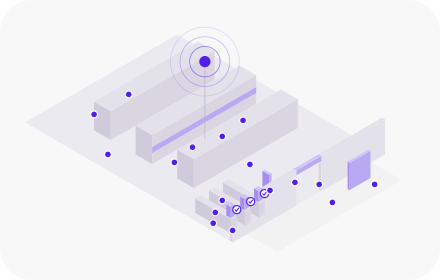
Illustration, not a current deployment: three working Wi-Fi access points support observed entrance presence. If one fails, that hour’s count becomes hybrid or modeled, depending on remaining coverage. Mark the change in the report; use the agreed rule for billing. Never present missing coverage as measured.
Attribution is not incrementality
A purchase after an ad is a link. Showing that the ad caused additional purchases needs a different design.
Attribution: a purchase linked
For attribution, state the matching rule, lookback window, observed or modeled exposure and identity coverage. The report must show which purchases could be linked, not imply every shopper was identified.
Incrementality: additional purchases
For incrementality, use a credible comparison of stores or shoppers that did not receive the ad: randomised, matched or another validated design. Address selection, promotions, seasonality and spill-over between groups. Without that counterfactual, do not call attributed purchases incremental sales.
Optional technical reference
Use these calculations and definitions to check the basis of a report. Planning opportunities are not verified delivery, attention or unique reach.
Planning formulas
| Calculation | Formula |
|---|---|
| Shopping groups entering | Shopping groups entering = purchase transaction events ÷ (share of groups that buy × transactions per buying group) |
| People entering | People entering = shopping groups entering + the people who came with them |
| Placement | How the estimate is calculated |
|---|---|
| Frontage screens | Storefront person-passages × visibility × contact frequency × operating factor |
| Entrance screens | Entering person-visits × entrance-route eligibility × visibility × contact frequency × operating factor |
| Checkout screens | Eligible purchasers and companions × checkout visibility × (checkout dwell ÷ message cadence) × operating factor |
| In-store screens | Entering person-visits × placement eligibility × contact frequency × operating factor |
| In-store radio | Entering person-visits × audio eligibility × (visit dwell ÷ audio message cadence) × operating factor |
Note: the transaction anchor may itself be modeled rather than observed; companions and visit frequency are assumptions. Placement scenarios can overlap and are not added together. Dwell divided by cadence gives expected contacts, not messages heard. Share of voice and schedule are planning adjustments; play evidence stays separate.
Use compatible time units for dwell and cadence.
Glossary
| Word | What it means in our reports |
|---|---|
| Play | An endpoint delivery event: the ad ran on a specific screen or speaker at a specific time. A fact about equipment, not about a person. |
| Modeled | An estimate produced from assumptions or inference, even when some of its inputs are observed. |
| Observed | An actual reading or event from a source, with its scope and quality stated. It does not make later calculations observed. |
| Hybrid | A result that combines observed and modeled parts; both parts are identified. |
| Qualified | A metric admitted under a named rule (zone, time, direction, coverage) and an agreed acceptance basis. |
| OTS and OTH | An opportunity to see or hear under the defined zone and time conditions. Not proof of attention. |
| LTS | A likelihood-to-see estimate from a validated method. Identity alone is not attention. |
| Reach and frequency | Deduplicated entities, and repeated eligible contacts, for a declared population, scope and period. |
| Attribution and incrementality | A purchase linked to exposure under a stated matching rule, versus the additional purchases estimated against a credible comparison group. |
Get started with the evidence your stores can support
Agree the metric, population and acceptance criteria before reporting or billing. Add evidence for a specific question, not technology for its own sake.
Four steps to rollout

Scenario and estimate
Share the store list, hours and screen inventory. Start with a modeled estimate; connected players confirm plays.

Add sales data
Replace purchasing assumptions with purchase events and define the method for outcome analysis.
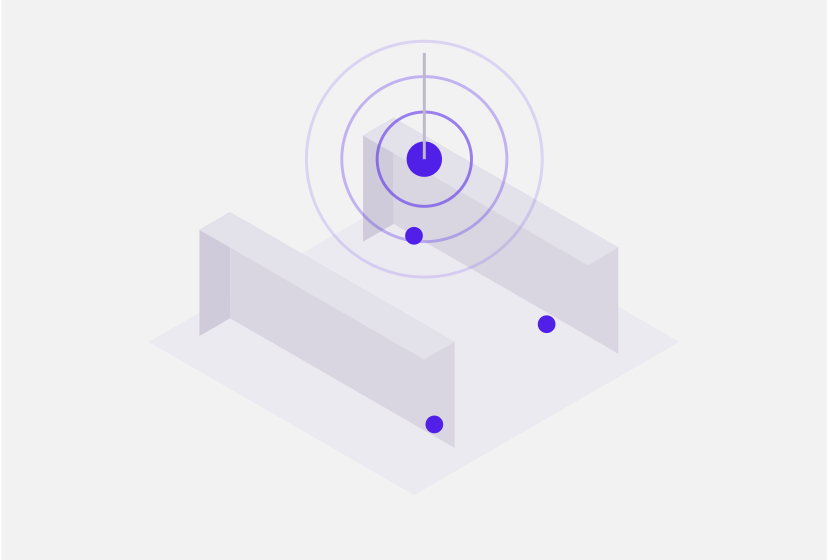
Add presence and location
Start with Wi-Fi, then cameras or the SDK where useful. Qualify each source for coverage, zone, time and population.

Validate, then use
In each store, trace a representative play from input through the rule and version to the reported result.
Validate before reporting or billing
Test each source on a real campaign in that store and confirm data-protection and contract conditions before use. For indoor positioning, acceptance also covers accuracy, latency, floor and zone discrimination, and time synchronisation.

